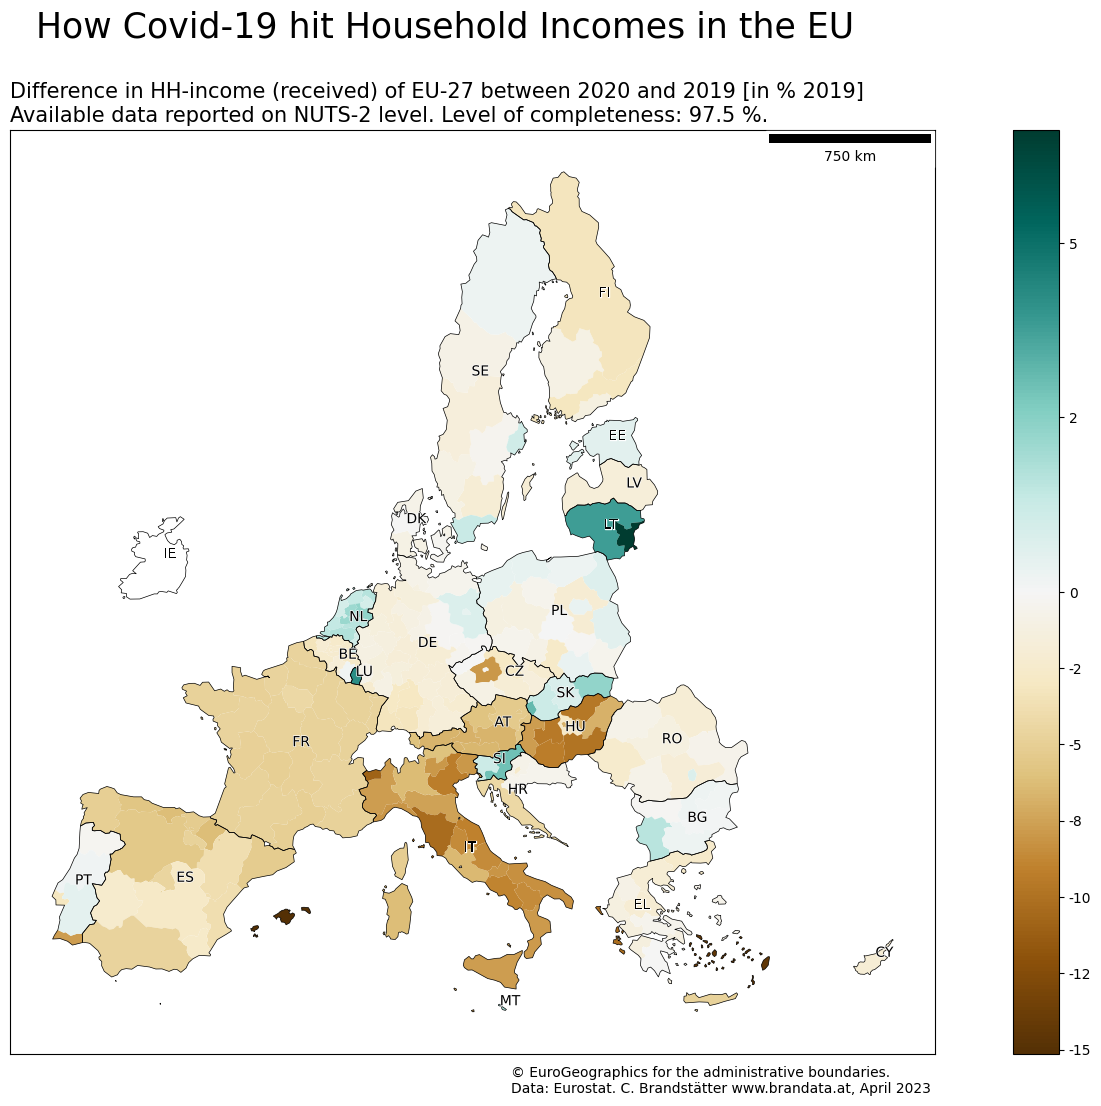
How did Covid-19 affect Europe economically?
To answer this question, we will first download data from Eurostat to assess the economic development, in particular the hh-income in the EU-27 for 2019 and 2020.
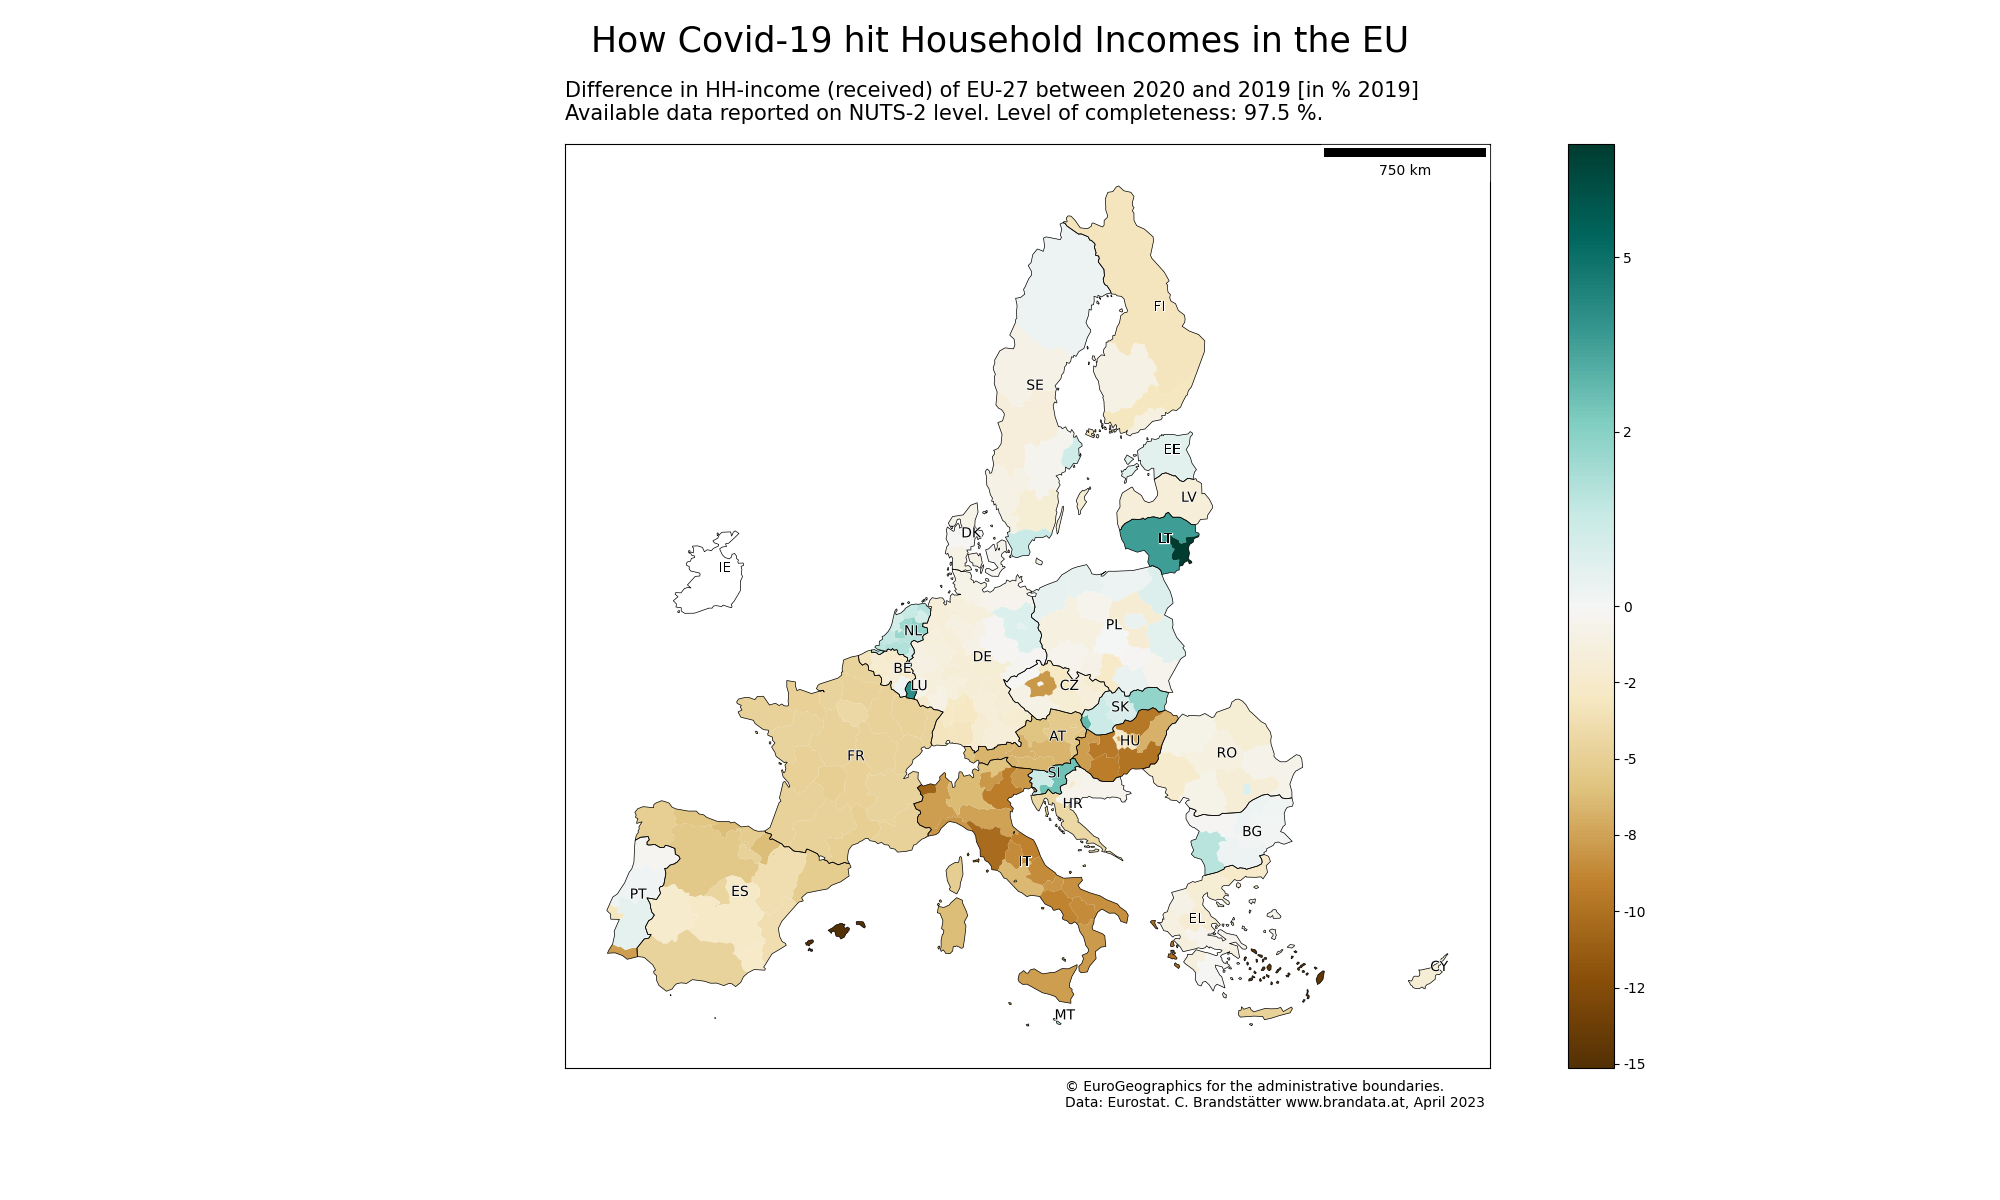
A bigger version of this plot can be found at the bottom of this notebook.
# Imports
import eurostat
import pandas as pd

# for mapping
import geopandas as gpd
# import shapefile
import geoplot as gplt
import geoplot.crs as gcrs
from tqdm.auto import tqdm
from shapely.geometry import Point, Polygon
from matplotlib_scalebar.scalebar import ScaleBar
import matplotlib.pyplot as plt
import matplotlib.colors as mcolors
import matplotlib.patheffects as pe
# eurostat TOC - Dataframe
toc_df = eurostat.get_toc_df()eurostat.subset_toc_df(toc_df, "income").head()| title | code | type | last update of data | last table structure change | data start | data end | |
|---|---|---|---|---|---|---|---|
| 279 | Income of households by NUTS 2 regions | NAMA_10R_2HHINC | dataset | 2023-02-21T23:00:00+0100 | 2023-02-21T23:00:00+0100 | 1995 | 2021 |
| 288 | Gross value added and income by A*10 industry ... | NAMA_10_A10 | dataset | 2023-04-27T23:00:00+0200 | 2023-02-20T23:00:00+0100 | 1975 | 2022 |
| 300 | GDP and main components (, expenditure a... | NAMA_10_GDP | dataset | 2023-04-27T23:00:00+0200 | 2023-02-16T23:00:00+0100 | 1975 | 2022 |
| 310 | GNI (gross national income) per capita in PPS | NAMA_10_PP | dataset | 2022-12-16T23:00:00+0100 | 2022-12-16T23:00:00+0100 | 2018 | 2021 |
| 311 | Gross value added and income A*10 industry bre... | NAMQ_10_A10 | dataset | 2023-04-27T23:00:00+0200 | 2023-02-16T23:00:00+0100 | 1975-Q1 | 2022-Q4 |
# Income of households by NUTS 2 regions
hh_income_nuts = eurostat.get_data_df("nama_10r_2hhinc", flags=False)
hh_income_nuts.head(2)| freq | unit | direct | na_item | geo\TIME_PERIOD | 1995 | 1996 | 1997 | 1998 | 1999 | ... | 2012 | 2013 | 2014 | 2015 | 2016 | 2017 | 2018 | 2019 | 2020 | 2021 | |
|---|---|---|---|---|---|---|---|---|---|---|---|---|---|---|---|---|---|---|---|---|---|
| 0 | A | EUR_HAB | BAL | B5N | AT | NaN | NaN | NaN | NaN | NaN | ... | 24500.0 | 24600.0 | 25000.0 | 25400.0 | 25600.0 | 26500.0 | 27600.0 | 28500.0 | 26900.0 | NaN |
| 1 | A | EUR_HAB | BAL | B5N | AT1 | NaN | NaN | NaN | NaN | NaN | ... | 24700.0 | 24600.0 | 25000.0 | 25200.0 | 25400.0 | 26100.0 | 27200.0 | 28100.0 | 26600.0 | NaN |
2 rows × 32 columns
Injection: NUTS
NUTS: Nomenclature of territorial units for statistics
https://ec.europa.eu/eurostat/web/gisco/geodata/reference-data/administrative-units-statistical-units/nuts
The NUTS level 2 is in layman's words a unified district level for European countris. We will look at available data on this NUTS2 level. The data has been previously downloaded as .shp.
Data Preparation
The following gives an overview about the dataset. To adress our question, we will filter the years 2020 and 2019.
# as can be seen, in 2020 264 regions have not reported their data yet.
hh_income_nuts.info()
<class 'pandas.core.frame.DataFrame'>
RangeIndex: 11390 entries, 0 to 11389
Data columns (total 32 columns):
# Column Non-Null Count Dtype
--- ------ -------------- -----
0 freq 11390 non-null object
1 unit 11390 non-null object
2 direct 11390 non-null object
3 na_item 11390 non-null object
4 geo\TIME_PERIOD 11390 non-null object
5 1995 1944 non-null float64
6 1996 1944 non-null float64
7 1997 1944 non-null float64
8 1998 1944 non-null float64
9 1999 1944 non-null float64
10 2000 11108 non-null float64
11 2001 11108 non-null float64
12 2002 11108 non-null float64
13 2003 11108 non-null float64
14 2004 11101 non-null float64
15 2005 11101 non-null float64
16 2006 11114 non-null float64
17 2007 11114 non-null float64
18 2008 11150 non-null float64
19 2009 11150 non-null float64
20 2010 11150 non-null float64
21 2011 11390 non-null float64
22 2012 11390 non-null float64
23 2013 11390 non-null float64
24 2014 11390 non-null float64
25 2015 11342 non-null float64
26 2016 11342 non-null float64
27 2017 11342 non-null float64
28 2018 11342 non-null float64
29 2019 11342 non-null float64
30 2020 11078 non-null float64
31 2021 2096 non-null float64
dtypes: float64(27), object(5)
memory usage: 2.8+ MBhh_income_recent = hh_income_nuts[["unit", "direct", "na_item",
"geo\TIME_PERIOD", "2020", "2019", "2018"]]There are four categorial variables, and some data variables, starting from 1995 up until 2020. Since there are only 371 NUTS-2 regions and we have 11452 values in 2018, we probably should filter the data.
hh_income_recent["unit"].value_counts()MIO_EUR 4558
MIO_NAC 4558
EUR_HAB 762
PPS_EU27_2020_HAB 762
MIO_PPS_EU27_2020 750
Name: unit, dtype: int64# as unit we will select MIO_EUR
nuts2_income_euro = hh_income_recent[hh_income_recent["unit"] == "MIO_EUR"]nuts2_income_euro["direct"].value_counts()PAID 1721
RECV 1670
BAL 1167
Name: direct, dtype: int64As direction we will chose received.
nuts2_income_euro_rec = nuts2_income_euro[nuts2_income_euro["direct"]=="RECV"]The variable na_item is not about missing values, but about national accounts indicators.
nuts2_income_euro_rec["CC"] = nuts2_income_euro_rec["geo\TIME_PERIOD"].apply(lambda x: x[:2])/tmp/ipykernel_5671/1167040726.py:1: SettingWithCopyWarning:
A value is trying to be set on a copy of a slice from a DataFrame.
Try using .loc[row_indexer,col_indexer] = value instead
See the caveats in the documentation: https://pandas.pydata.org/pandas-docs/stable/user_guide/indexing.html#returning-a-view-versus-a-copy
nuts2_income_euro_rec["CC"] = nuts2_income_euro_rec["geo\TIME_PERIOD"].apply(lambda x: x[:2])Unfortunately, this needs to be adressed, since the data was reported for different purposes. A list of na_items can be found here: https://dd.eionet.europa.eu/vocabulary/eurostat/na_item/view
We will include only D1 (Compensation of employees), D4 (Property income). The code D7 (Other current transfers) is a bit unclear and will not be included for further analysis.
nuts2_income_euro_na = nuts2_income_euro_rec[nuts2_income_euro_rec["na_item"].isin(["D1", "D4"])]Now, we will select only NUTS-2 regions.
# Download and preparation of NUTS 2 Codes.
nuts_region = pd.read_excel("https://ec.europa.eu/eurostat/documents/345175/629341/NUTS2021.xlsx",
              sheet_name="NUTS & SR 2021", nrows=1846) # Careful: below statistical regions start
nuts2_codes = nuts_region[~nuts_region["NUTS level 2"].isna()]
nuts2_codes_nn = nuts2_codes[~nuts2_codes["Code 2021"].isna()]
nuts2_income = nuts2_income_euro_na[nuts2_income_euro_na["geo\TIME_PERIOD"]\
.isin(nuts2_codes_nn["Code 2021"])]Checking, if many NA-values are present
nuts2_income.groupby(["direct", "na_item"]).agg({np.mean, lambda x: x.isnull().sum()})/tmp/ipykernel_5671/1579563077.py:1: FutureWarning: ['unit', 'geo\\TIME_PERIOD', 'CC'] did not aggregate successfully. If any error is raised this will raise in a future version of pandas. Drop these columns/ops to avoid this warning.
nuts2_income.groupby(["direct", "na_item"]).agg({np.mean, lambda x: x.isnull().sum()})| 2020 | 2019 | 2018 | |||||
|---|---|---|---|---|---|---|---|
| <lambda_0> | mean | <lambda_0> | mean | <lambda_0> | mean | ||
| direct | na_item | ||||||
| RECV | D1 | 2 | 26422.948612 | 1 | 26734.023862 | 1 | 25748.720650 |
| D4 | 1 | 3370.212593 | 1 | 3870.998313 | 1 | 3891.949794 | |
Now, both the property income as well as the labour income will be added.
nuts2_income_final = nuts2_income.groupby(["geo\TIME_PERIOD"]).sum().reset_index()
nuts2_income_final.rename(columns={"geo\TIME_PERIOD":"NUTS_Code"}, inplace=True)
nuts2_income_final.head()
/tmp/ipykernel_5671/2980442314.py:1: FutureWarning: The default value of numeric_only in DataFrameGroupBy.sum is deprecated. In a future version, numeric_only will default to False. Either specify numeric_only or select only columns which should be valid for the function.
nuts2_income_final = nuts2_income.groupby(["geo\TIME_PERIOD"]).sum().reset_index()| NUTS_Code | 2020 | 2019 | 2018 | |
|---|---|---|---|---|
| 0 | AT11 | 6621.0 | 7019.0 | 6751.0 |
| 1 | AT12 | 40437.0 | 42744.0 | 41233.0 |
| 2 | AT13 | 42842.0 | 45370.0 | 43286.0 |
| 3 | AT21 | 11975.0 | 12820.0 | 12371.0 |
| 4 | AT22 | 27689.0 | 29658.0 | 28500.0 |
We got a coverage of 250 NUTS 2 regions. Now we will calculate a simple corona indicator as the difference between 2020 and 2019, relative to 2019. The lower this number, the lower was the difference in economic growth between those 2 years.
nuts2_income_final["corona"] = (nuts2_income_final["2020"] - nuts2_income_final["2019"]) /\
nuts2_income_final["2019"] * 100nuts2_income_final.head()| NUTS_Code | 2020 | 2019 | 2018 | corona | |
|---|---|---|---|---|---|
| 0 | AT11 | 6621.0 | 7019.0 | 6751.0 | -5.670323 |
| 1 | AT12 | 40437.0 | 42744.0 | 41233.0 | -5.397249 |
| 2 | AT13 | 42842.0 | 45370.0 | 43286.0 | -5.571964 |
| 3 | AT21 | 11975.0 | 12820.0 | 12371.0 | -6.591264 |
| 4 | AT22 | 27689.0 | 29658.0 | 28500.0 | -6.639018 |
Mapping of the data
# read the NUTS shapefile and extract the polygons for a individual countries
nuts = gpd.read_file("./Data/Nuts2/NUTS_RG_20M_2021_3035.shp")
nuts.crs = "EPSG:3035"
# representitive_point for labelling (in die Spalte coords)
nuts['coords'] = nuts['geometry'].apply(lambda x: x.representative_point().coords[:])
nuts['coords'] = [coords[0] for coords in nuts['coords']]countries = nuts[nuts["LEVL_CODE"]==0]countries_sel = countries[~countries["NUTS_ID"].isin(["TR", "IS", "UK", "LI", "NO",
"AL", "ME", "MK", "RS", "CH"])]# countries_sel = countries# Data Selection, remove duplicates
countries_lv2 = nuts[nuts["LEVL_CODE"]==2]
countries_lv2_unique = countries_lv2[~countries_lv2.duplicated(subset="NUTS_ID")]# Combination of Eurostat-Data with NUTS2-map
df_merged = countries_lv2_unique.merge(nuts2_income_final, left_on='FID',
right_on='NUTS_Code')# European Bounding Box
# To reduce the map size (and not to include e.g. Caribean islands)
# http://bboxfinder.com/#35.317366,-24.082031,71.413177,46.230469
x1 = 1303552.3576+1000000
y1 = 2047374.7227-1000000
x2 = 5556364.6588+1500000
y2 = 5701700.2014
np1 = (x1, y1)
np2 = (x1, y2)
np3 = (x2, y2)
np4 = (x2, y1)
bb_polygon = Polygon([np1, np2, np3, np4])
bb = gpd.GeoDataFrame(gpd.GeoSeries(bb_polygon), columns=['geometry'])
bb.crs = "EPSG:3035"
europa = gpd.overlay(df_merged, bb, how='intersection')
europa_countries = gpd.overlay(countries_sel, bb, how='intersection')map = europa.plot(column = 'corona',
legend = True,
figsize = [20,12],
vmax=35,
cmap="BrBG", norm=mcolors.TwoSlopeNorm(vcenter = 0,
vmin = europa.corona.min(),
vmax = europa.corona.max()),
legend_kwds = {
'format': "%.0f"
}
)
map.get_xaxis().set_visible(False)
map.get_yaxis().set_visible(False)
for x, y, label in zip(countries_sel.coords.str[0],
countries_sel.coords.str[1],
countries_sel.CNTR_CODE):
map.annotate(label, xy=(x, y), c="black",
path_effects=[pe.withStroke(linewidth=1, foreground="white")])
# countries_sel.plot(ax=map, column="geometry", edgecolor='black')
europa_countries.geometry.boundary.plot(color=None,edgecolor='k',
linewidth = 0.5, ax=map)
plt.suptitle("How Covid-19 hit Household Incomes in the EU", fontsize=25)
map.set_title("Difference in HH-income (received) of EU-27 between 2020 and 2019 [in % 2019] \nAvailable data reported on NUTS-2 level. Level of completeness: 97.5 %. "
,fontsize=15, loc="left")
# map.patch.set_facecolor('black')
map.add_artist(ScaleBar(1))
map.text(y=y1, x = x2-23e5,
s="© EuroGeographics for the administrative boundaries. \nData: Eurostat. C. Brandstätter www.brandata.at, April 2023")
plt.savefig('Corona_Map_Europe.png')